I just looked at new North Carolina voter registrations to see if voter registration trends from before the 2020 General Election are holding for 2024. It seems they’ve changed!
Background
To win an election, you must first register a lot of voters. Elections also matter: they have real practical outcomes for voters and so voters should care about voter registration and the momentum around it. Southern states have structural advantages in the Electoral College, so their electoral outcomes are frequently national ones. Some states (like NC) may be diversifying demographically and politically faster than others, but are affected by the crazy gerrymandering of the state legislative districts.
To recap 2020, Biden lost NC to Trump by about 74k votes, or about 1.3% of votes cast. State Democrats also lost the state Supreme Court, lost State House seats, and lost the opportunity to push fairer electoral maps following the 2020 Census. I donated to the Long Leaf Pine Slate, which lost 15 of 17 races they backed! Nationally, the Democratic Party’s ground organizing campaign focused on mail-in voting (which was successful) but prohibited in-person organizing until September 2020 due to obvious COVID-19 concerns. The NC GOP, as far as I could tell, simply adopted social distancing and masking policies for in-person registrations well before the Democratic Party.
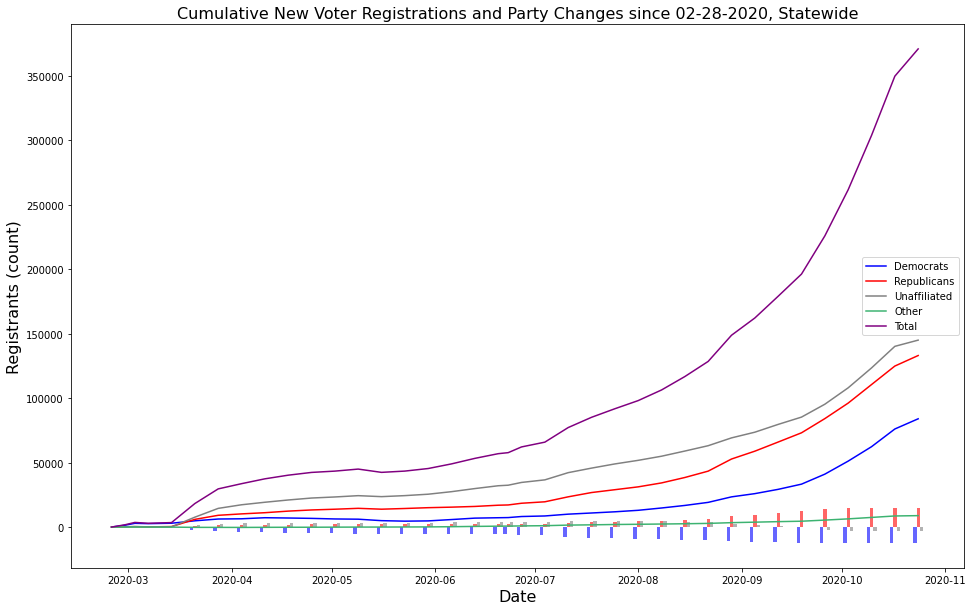
You can kind of see this in the accumulated voter registration totals leading up to the election with the Democrats lagging new registrations into Election Day:
2024 … As of December 2023
For additional commentary on this, see the writeup from September 2023!
New registration totals since November 2020:
| Party      | All    | w/o Meck/Wake |
|:-----------|-------:| -------------:|
| DEM        | 329942 |        240560 |
| REP        | 338680 |        292778 |
| THIRD      |  17816 |        14002  |
| UNA        | 612784 |        472383 |
Initial Look: 2024 … As of September 2023
New registration totals since November 2020:
| Party      | All    | w/o Meck/Wake |
|:-----------|-------:| -------------:|
| DEM        | 307628 |        223729 |
| REP        | 309917 |        267982 |
| THIRD      |  13252 |        10428  |
| UNA        | 561085 |        432133 |
Unaffiliated voters still dominate the voter registrations (as they have for some time), but new Democratic and GOP voter registrations since December 2020 are approximately even! The gap between newly registered Republicans and Democrats is less than 3k.
Wake and Mecklenburg County still make up a huge fraction of the new electorate and they are the biggest urban Democratic counties in the state. As of August 2024, the ‘No Labels’ Party is official in NC, with about 400 people registered, of which 52 are in Wake County.
If you exclude Wake and Mecklenburg the registration gap grows but isn’t that huge (around 43k). I would have expected something much larger, given the past organizing resources thrown at these larger counties.
No notable registration bumps following June 2022, which is when the Dobbs Supreme Court ruling overturned Roe. Registration bumps coincide with state primaries and during the midterms, which is not surprising.
Methods
I love that it’s possible for anyone to do this kind of analysis at home using open source tools. To generate these graphs above I used Pandas and a Jupyter notebook and you can follow a similar process for your state. In the following, I’ll talk through the process using the NC voter file, using similar analysis to the one I posted here in 2020.
Getting the Data
The NC Board of Elections maintains a page where you can download the public voter file. Some quick links:
If you’re setup with AWS and use the terminal, you can download these files directly from where they’re hosted:
$ aws s3 cp s3://dl.ncsbe.gov/data/ncvoter_Statewide.zip .
$ aws s3 cp s3://dl.ncsbe.gov/data/layout_ncvoter.txt .
Normalize the Data
The statewide voter file is big: about 3.6G and almost 8.4M rows (as of 09-03-2023). Like voter files everywhere, it contains a huge amount of identifying information that would be considered private in any other context. I didn’t want to exhaust my RAM while plotting data, so I parsed and simplified this dataset to something smaller and less creepy: new, active registrations since the last general election, voter demographics, and city/county data.
import pandas as pd

# Parse the data (drops a few records)
df = pd.read_csv('ncvoter_Statewide.txt',
                   delim_whitespace=True,
                   on_bad_lines='skip',
                   encoding_errors='ignore',
                   parse_dates=['registr_dt'],
                   infer_datetime_format=True)

# Normalize and save subset of interest
to_keep = ['registr_dt', 'voter_status_desc',
           'birth_year','race_code', 'ethnic_code', 'gender_code',
           'party_cd', 'county_desc', 'res_city_desc']
start_date = '2020-12-01'
newly_registered = df[to_keep][df['registr_dt'] > start_date]
newly_registered = newly_registered[newly_registered['voter_status_desc'] == 'ACTIVE']

# Group all third parties, including 'No Labels' (!)
newly_registered['party_cd'] \
    = newly_registered['party_cd'].replace(['LIB', 'NLB', 'LIB', 'GRE'], 'THIRD')

# Save the subset
newly_registered.to_csv('ncvoter_Statewide_post-2020-12-01.csv', index=False)
The layout_ncvoter.txt includes a schema for the voter file. This is the
subset for the columns I selected above:
------------------------------------------------------------------------------------
name                    data type          description
------------------------------------------------------------------------------------
county_desc             varchar(15)        County name
voter_status_desc       varchar(25)        Registration status description
registr_dt              char(10)           Registration date
res_city_desc           varchar(60)        Residential city name
race_code               char(3)            Race code
ethnic_code             char(3)            Ethnicity code
party_cd                char(3)            Registered party code
gender_code             char(1)            Gender/sex code
birth_year              char(4)            Year of birth
The resulting table newly_registered is much smaller: about 1.2M records for a
62MB CSV file. The contents (from newly_registered.head()) looks like this:
|    | registr_dt          | voter_status_desc   |   birth_year | race_code   | ethnic_code   | gender_code   | party_cd   | county_desc   | res_city_desc   |
|---:|:--------------------|:--------------------|-------------:|:------------|:--------------|:--------------|:-----------|:--------------|:----------------|
|  0 | 2023-05-09 00:00:00 | ACTIVE              |         1945 | W           | NL            | M             | REP        | ALAMANCE      | GRAHAM          |
|  1 | 2023-05-17 00:00:00 | ACTIVE              |         1967 | W           | NL            | F             | REP        | ALAMANCE      | HAW RIVER       |
|  2 | 2021-04-15 00:00:00 | ACTIVE              |         2003 | W           | NL            | M             | REP        | ALAMANCE      | GIBSONVILLE     |
|  3 | 2021-05-21 00:00:00 | ACTIVE              |         1981 | B           | NL            | M             | UNA        | ALAMANCE      | BURLINGTON      |
|  4 | 2022-10-07 00:00:00 | ACTIVE              |         1992 | W           | NL            | F             | REP        | ALAMANCE      | MEBANE          |
Analysis: County Aggregates
To get the county aggregates you:
- group by county name and party registration
- count those groups
- pivot counts by party registration and total for each county
# Color coding
COLORS = {'DEM': 'blue', 'REP': 'red', 'THIRD': 'green', 'UNA':'purple'}
parties = ['DEM', 'REP', 'THIRD', 'UNA']

# Group, count, and pivot
# Note: following .count(), all columns have the same value, so choose any one and rename to count
groupby = ['county_desc', 'party_cd']
total_by_county = newly_registered.groupby(groupby).count()['birth_year'] \
   .reset_index() \
   .rename(columns={'birth_year': 'count'})\
   .pivot_table(values='count', index='county_desc', columns='party_cd')
total_by_county['ALL'] = total_by_county.sum(axis=1)
total_by_county = total_by_county.sort_values(by='ALL')
total_by_county

ax = total_by_county[parties.plot.bar(stacked=True, color=COLORS)
ax.set_title('Statewide New Voter Registrations Since 12-01-2020',)
ax.set_xlabel('County')
ax.set_ylabel('Registrations (count)')
Some sample data:
| county_desc   |   DEM |   REP |   THIRD |   UNA |   ALL |
|:--------------|------:|------:|--------:|------:|------:|
| TYRRELL       |    65 |    65 |     nan |   104 |   234 |
| HYDE          |    93 |   131 |       2 |   160 |   386 |
| GRAHAM        |    73 |   402 |       9 |   287 |   771 |
| GATES         |   204 |   330 |      18 |   428 |   980 |
| WASHINGTON    |   283 |   255 |       9 |   438 |   985 |
Analysis: Monthly Registrations
This will produce demographic statistics similar to what you’d find on the NC Registration Statistics page. To get these demographics you group by registration week and demographic feature (race/ethnicity, gender/sex, and party registration) and then count.
groupby = [pd.Grouper(key='registr_dt', freq="M"),
          'race_code', 'ethnic_code', 'gender_code', 'party_cd']
monthly_voter_stats = newly_registered.sort_values('registr_dt') \
                      .groupby(groupby) \
                      .count()['birth_year'] \
                      .reset_index() \
                      .rename(columns={'birth_year': 'count'})
monthly_voter_stats
Some sample data:
|    | registr_dt          | race_code   | ethnic_code   | gender_code   | party_cd   |   count |
|---:|:--------------------|:------------|:--------------|:--------------|:-----------|--------:|
|  0 | 2020-12-31 00:00:00 | A           | HL            | M             | UNA        |       2 |
|  1 | 2020-12-31 00:00:00 | A           | NL            | F             | DEM        |      53 |
|  2 | 2020-12-31 00:00:00 | A           | NL            | F             | REP        |      25 |
|  3 | 2020-12-31 00:00:00 | A           | NL            | F             | THIRD      |       2 |
|  4 | 2020-12-31 00:00:00 | A           | NL            | F             | UNA        |      72 |
You can then pivot with:
monthly_voter_stats.groupby(['registr_dt', 'party_cd'])['count'].sum() \
  .reset_index()\
  .pivot_table(values='count', index='registr_dt', columns='party_cd')
to get:
| registr_dt          |   DEM |   REP |   THIRD |   UNA |
|:--------------------|------:|------:|--------:|------:|
| 2020-12-31 00:00:00 |  5950 |  6756 |     288 | 10279 |
| 2021-01-31 00:00:00 |  6601 |  6621 |     287 | 11026 |
| 2021-02-28 00:00:00 |  6834 |  6700 |     314 | 11104 |
| 2021-03-31 00:00:00 |  8395 |  8672 |     336 | 13642 |
| 2021-04-30 00:00:00 |  7892 |  7985 |     325 | 12829 |
Changelog
- 12-28-2023. Updated to include registration numbers through 2023.
- 09-04-2023. Initial post.
